The PeopleSoft Pivot Grid is a reporting tool used to provide a pivot table and chart representation of live data using PS Query data source. This enables users to visually display data in a dashboard. Data can be displayed in different views by performing operations such as pivoting and filtering, which enables business analysts to interpret data in a variety of ways.

Business Benefits:
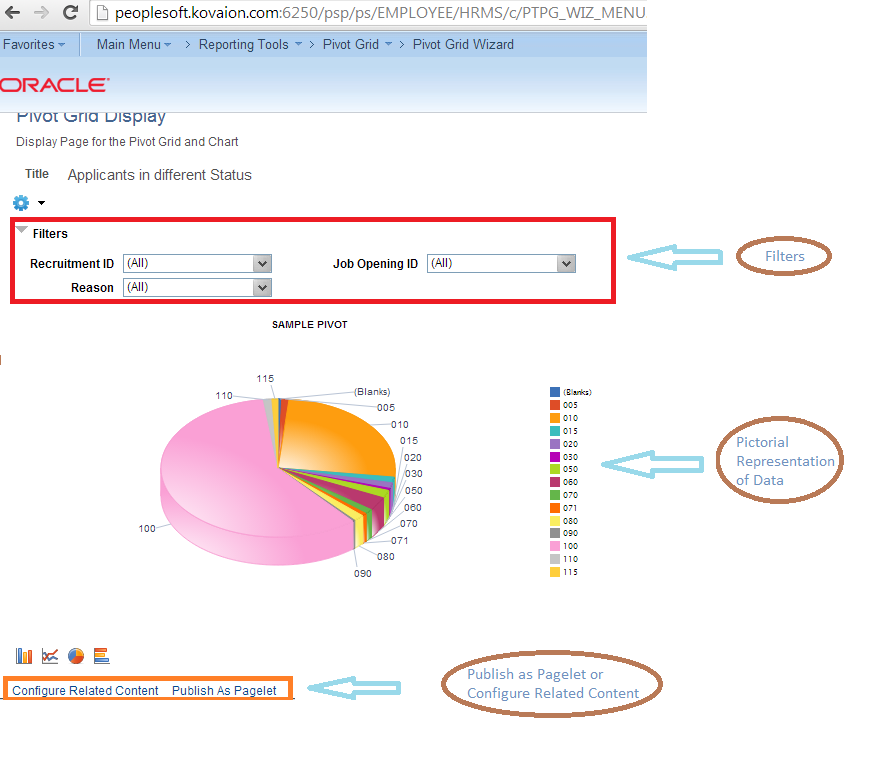
- Pivot grids can be published as pagelets, so can be published on home page or any other navigation.
E.g.: Managers can use this pivot grid on their Dashboard to track the Employees Report, Direct Line Reports, Employees Head count etc…
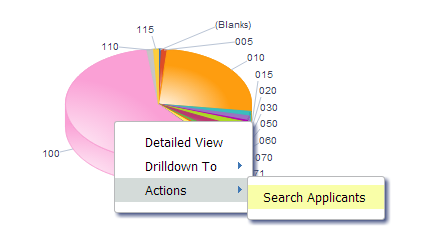
- Users can take action directly from the chart/report. - Related Content can be configured in Pivot grid.
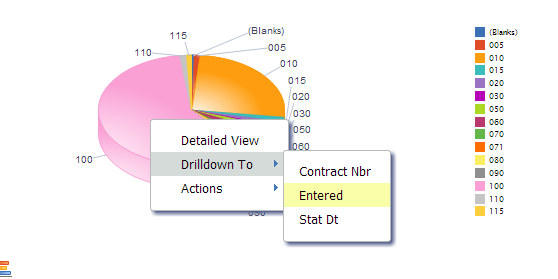
- Drilling Down on the Aggregate Values
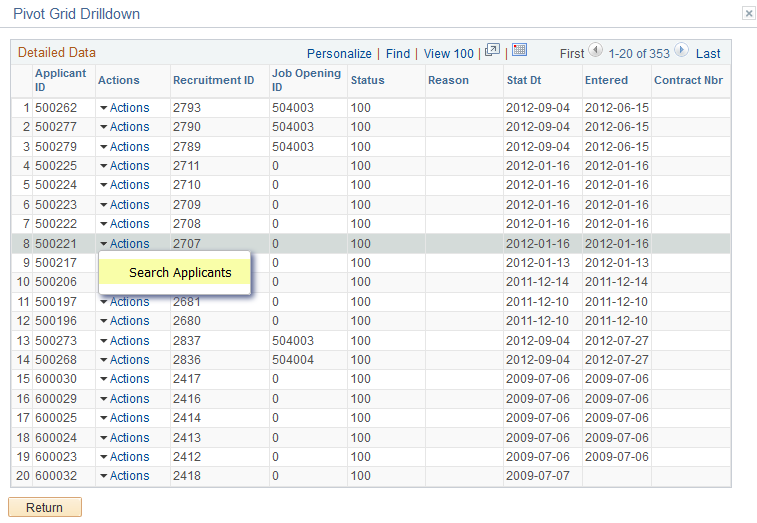
The detailed view displays the complete data of the grid and Actions dropdown helps navigate to related links or action can be taken.
- Inter Window Communication: Pivot Grid Pagelets can interact with each other and with the transaction pages. Configure Publication and Subscription with all the intersecting Prompt and Filter values between Pivot grids. We get the consistent behavior with progressive filtering in the publisher and subscriber.
- Pivot grids can be published as Related Content on any of the components, so that the user can refer them easily.
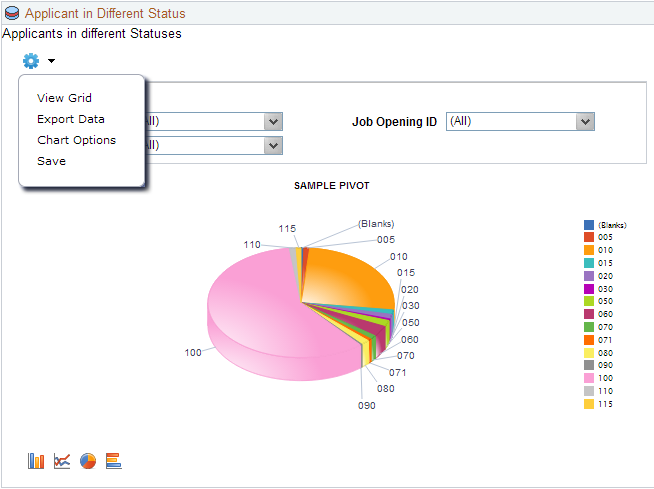
- Displaying Grid from Chart-only view - Display the grid from a chart-only view and then perform various actions—such as pivoting data, dragging and dropping, and slicing and filtering data—to change the grid layout. After the layout is satisfactory, you can synchronize the chart with the grid view.
- View grid option allows user to display the results of the query in grid format and filters can be applied.
- PeopleSoft Pivot Grids allow the user to analyze data within the PeopleSoft application. The advantage here is that, as we all know, initial data analysis often leads to more questions and a need for deeper analysis. PeopleSoft Pivot Grids allow the user to dive deeper, all the way down to the transactional level into the system to grab more data for the desktop spreadsheet. It is cleaner, easier and more efficient.
- Pivot Grids allow the user in a specific job role to focus on the activities that are most important to their specific job requirements. The user is able to immediately access the most Relevant information for their role. Information is easily prioritized and action lists can be created.
Development Process
Pivot grid can be developed in five easy steps:
Navigation: Main Menu -> Reporting Tools -> Pivot Grid -> Pivot Grid Wizard.
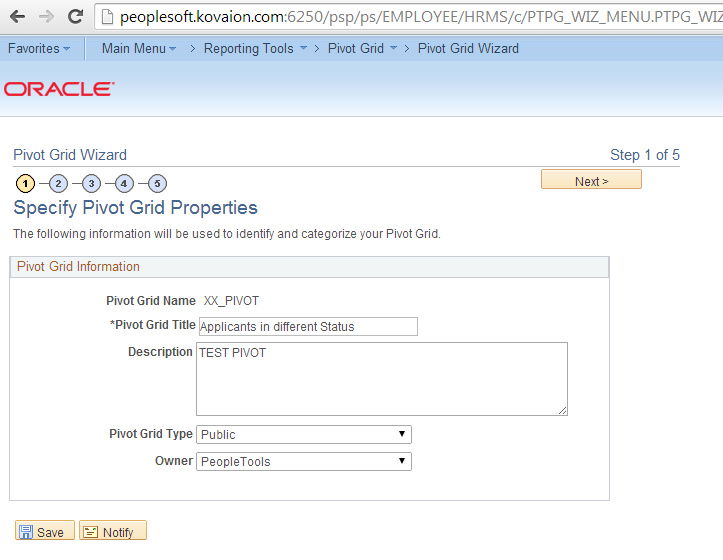
Step1: Provide pivot grid basic details - grid name, title and type.
Step 2: Provide data source type and PS Query name.
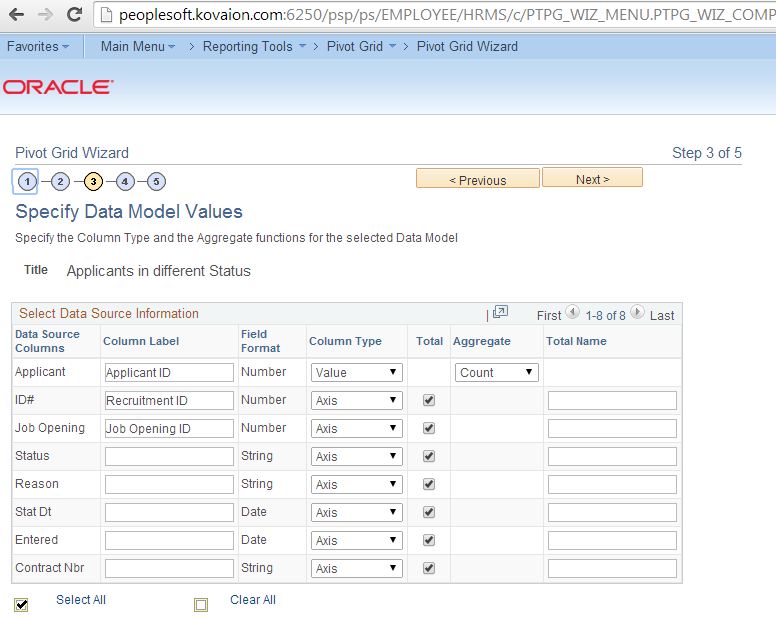
Step 3: Provide data model values. At least one value and axis for the column should be specified.
Along with at least one value and axis specifying for the columns.
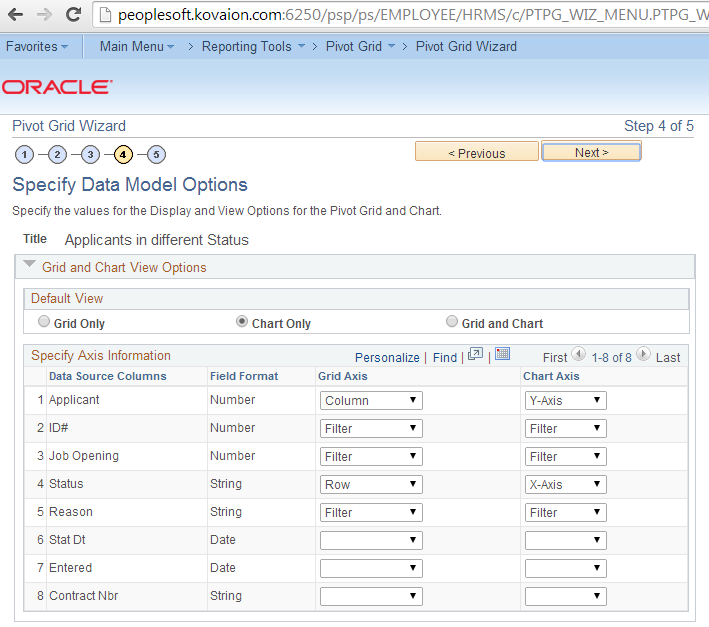
Step 4: Provide X and Y axis and filters.
Specify data model options providing X and Y Axis and specify filtering in fourth step.
Step 5: Verify the pivot grid, publish it as pagelets or related content.
Limitations on Pivot Grid:
- Supports only PS Query as data source.
- Pivot Grid Does not have a Vertical Scroll bar for viewing data, but it displays all possible rows based on the current layout.
Author,
Dilip Kumar
Tools Group
Tools Group
dilip.kumar@kovaion.com
Nice Post. Really appreciate it.
ReplyDeletegood article. could you please explain how do we publish it as pagelets or related content?
ReplyDeleteHi!
ReplyDeleteYou can publish it as HCM Dashboard, and click the added pagelet by going through the navigation PeopleTools >Portal > Dashboard > Manage Dashboard Pagelets, from here you can select the added Pagelet.